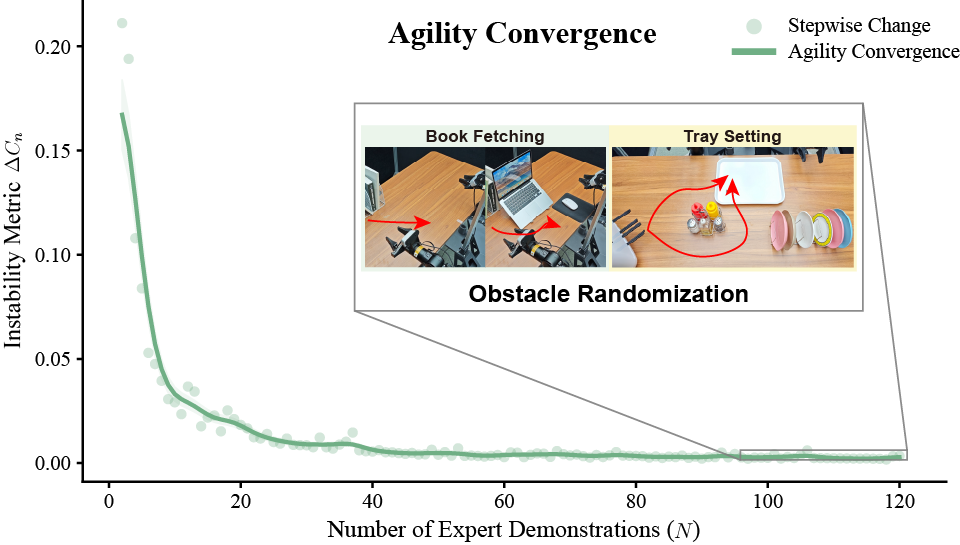
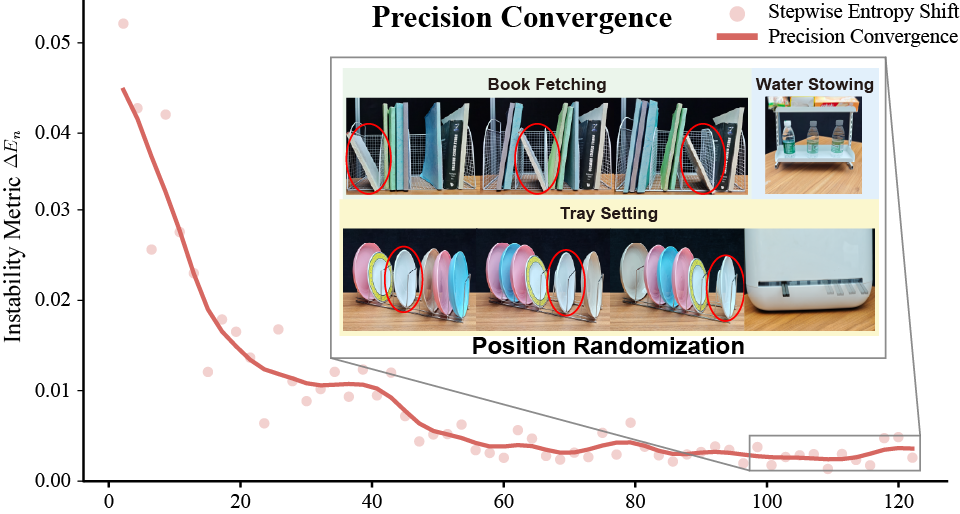
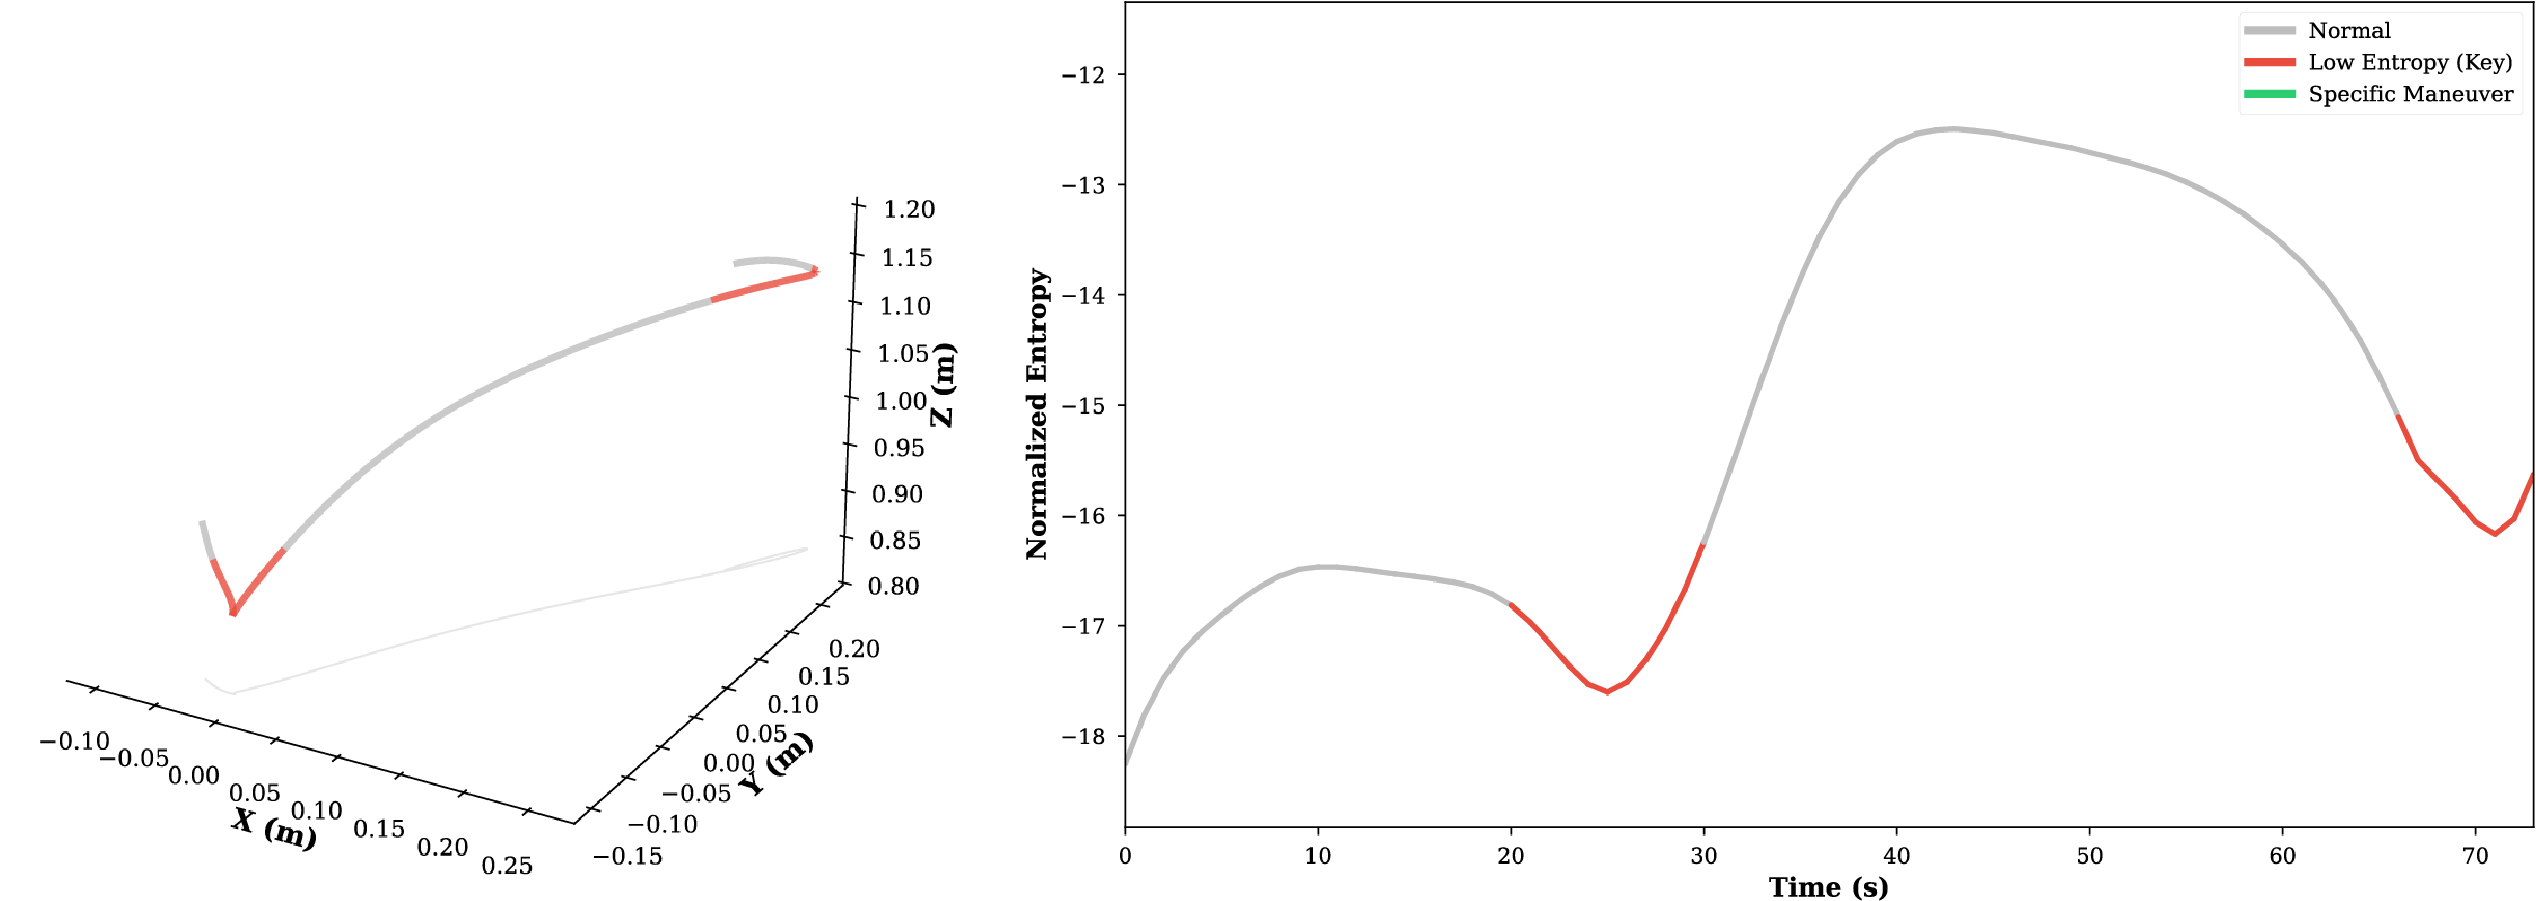
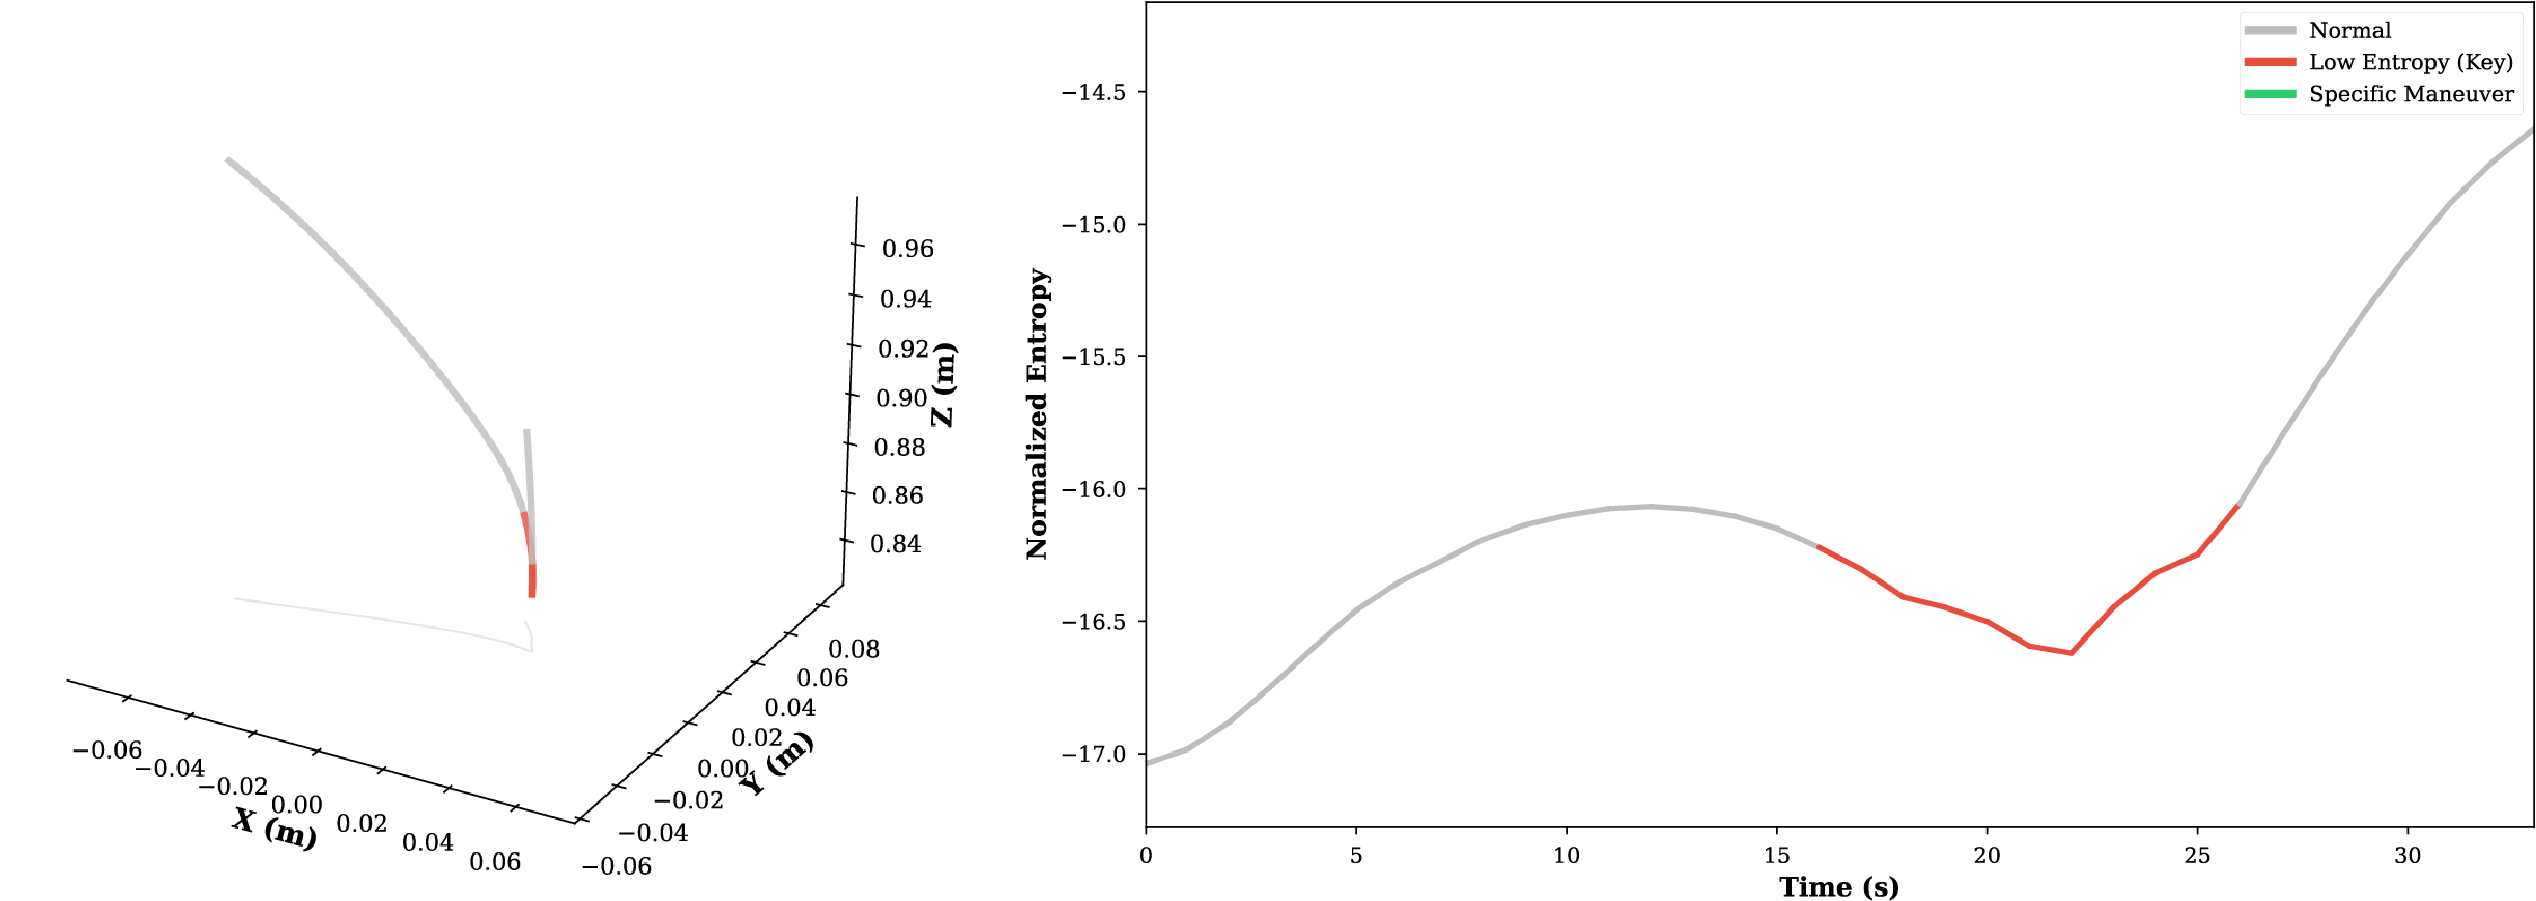
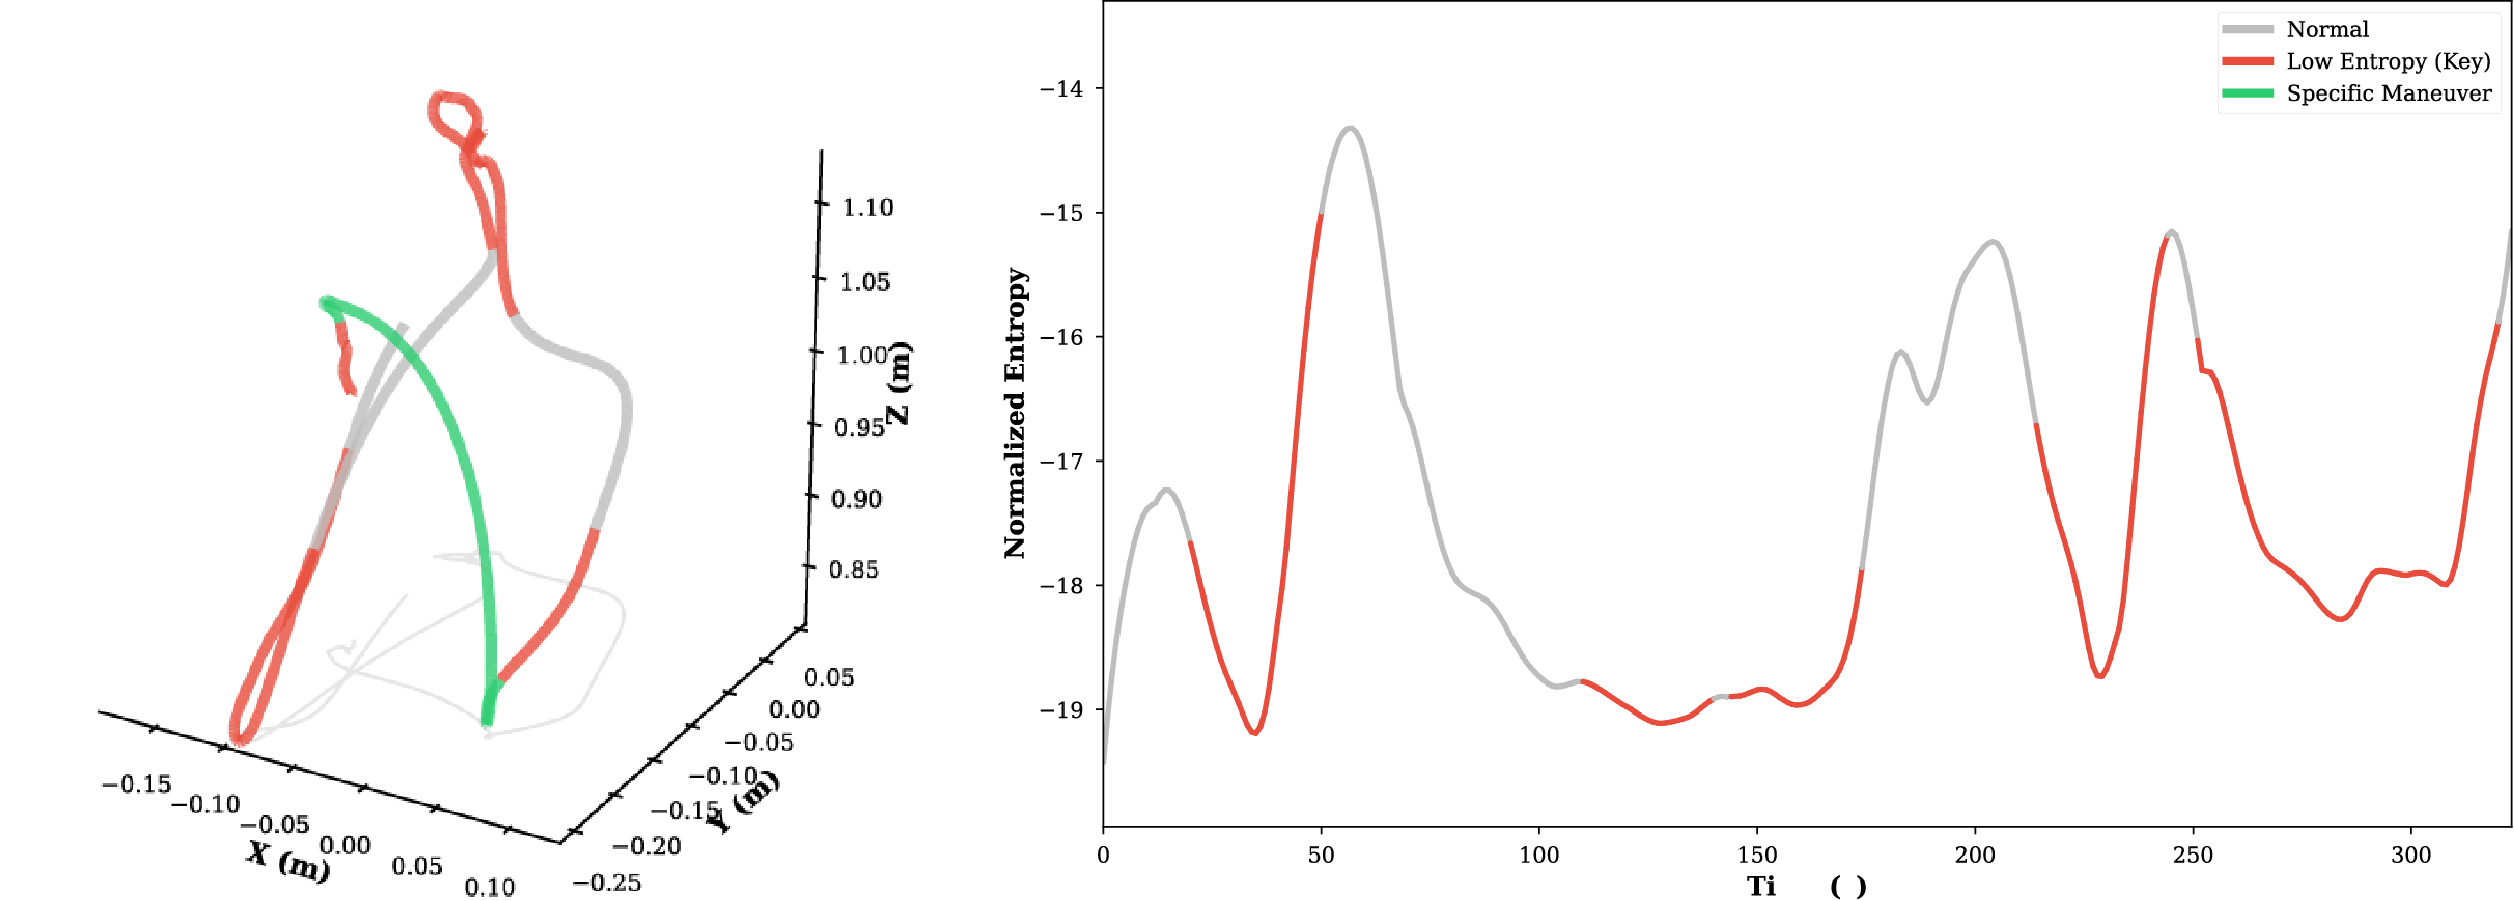
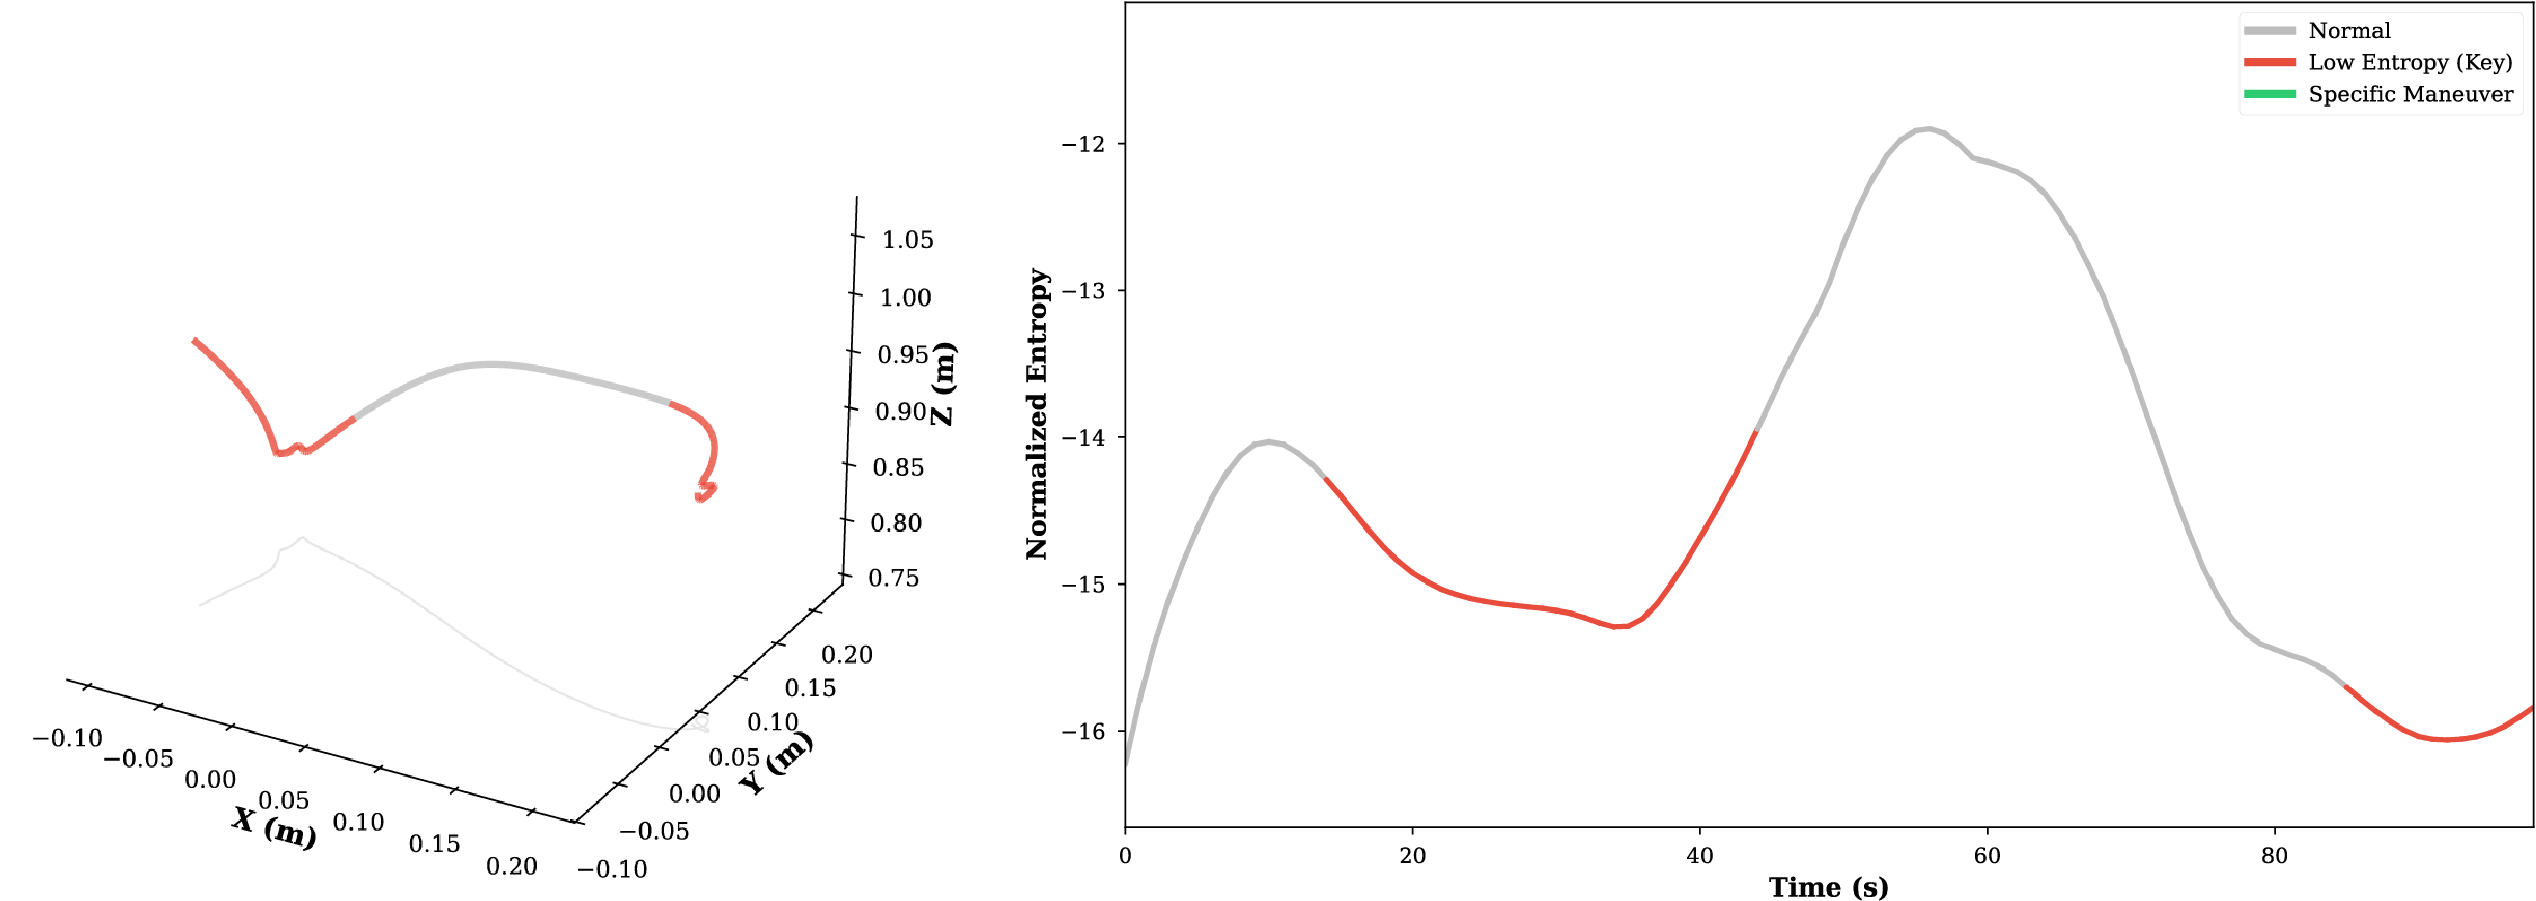
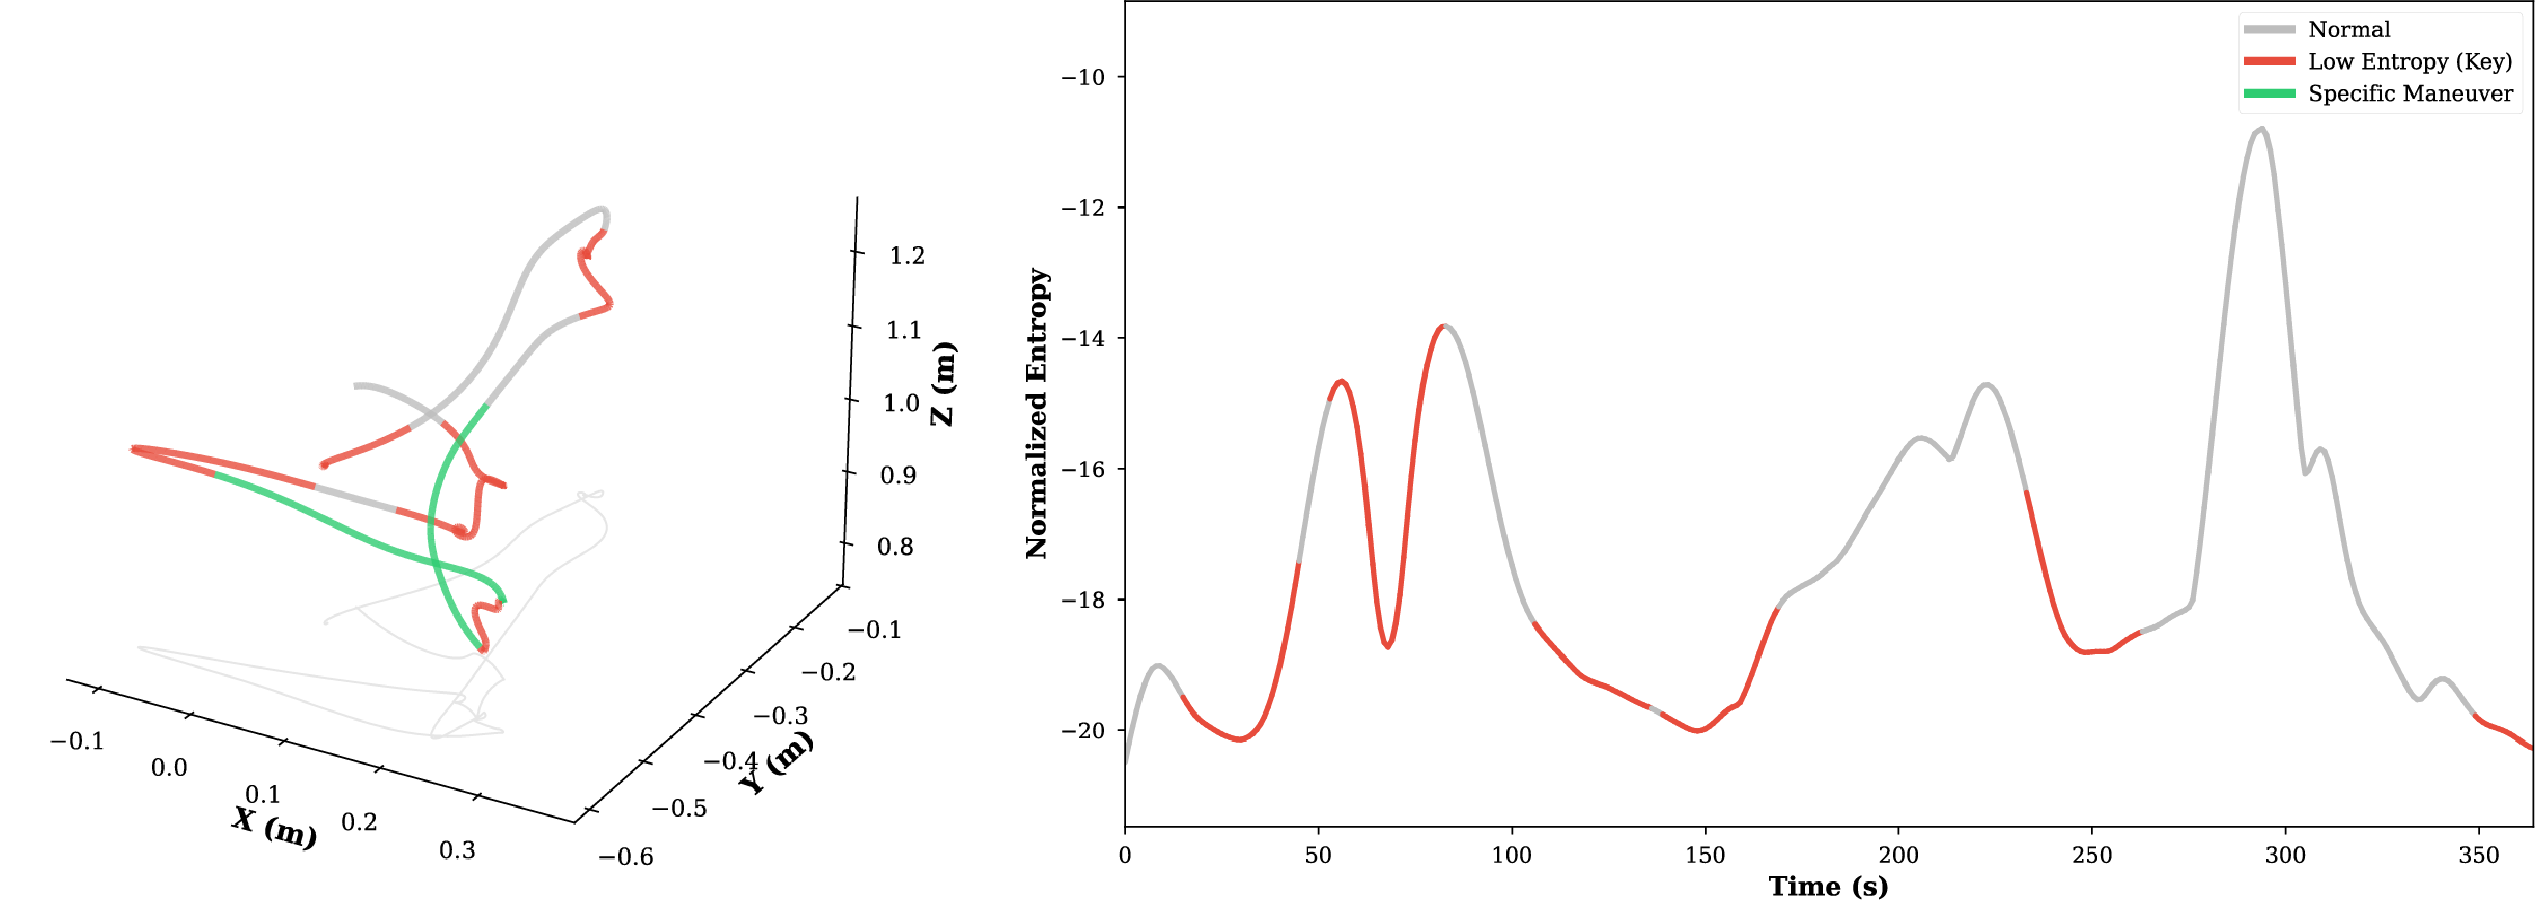
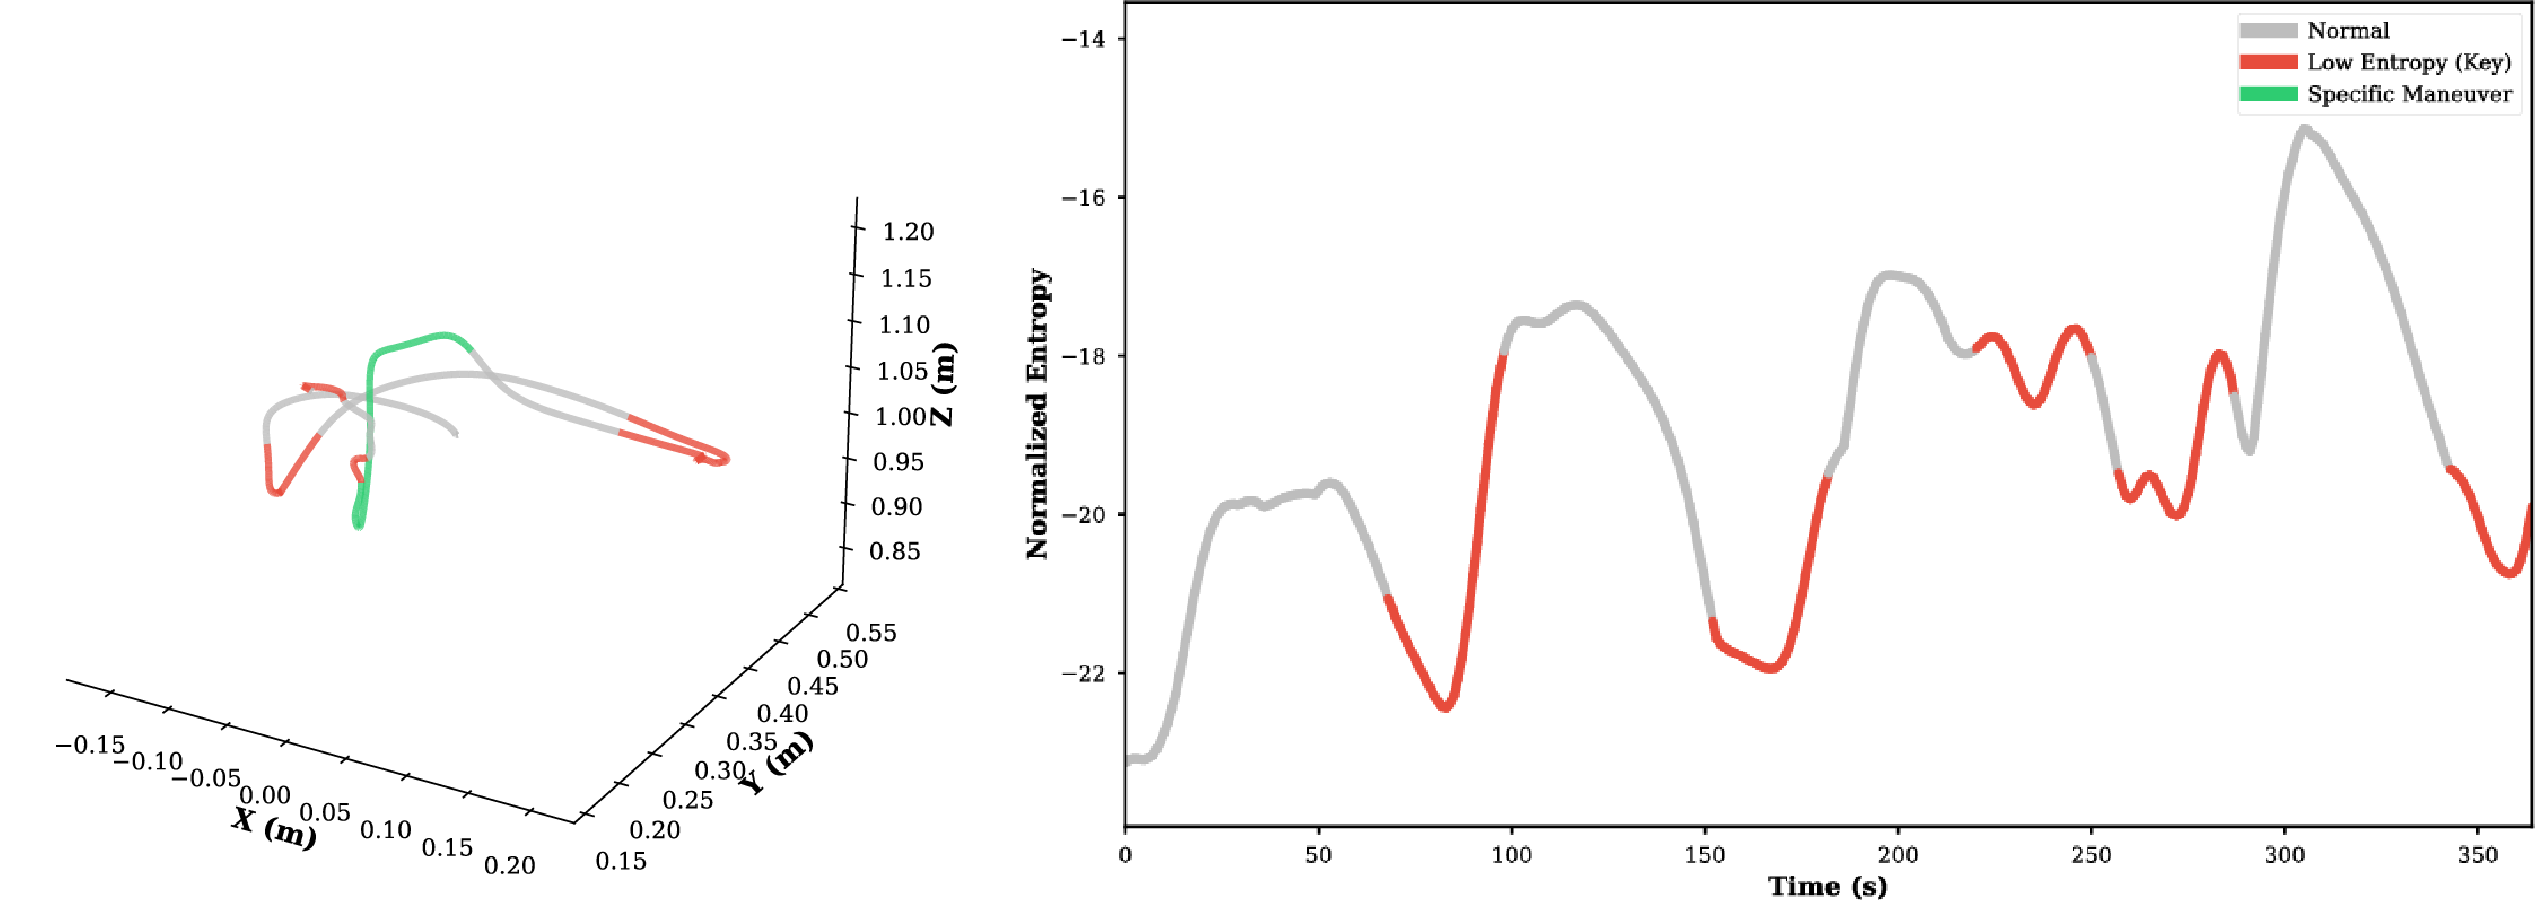
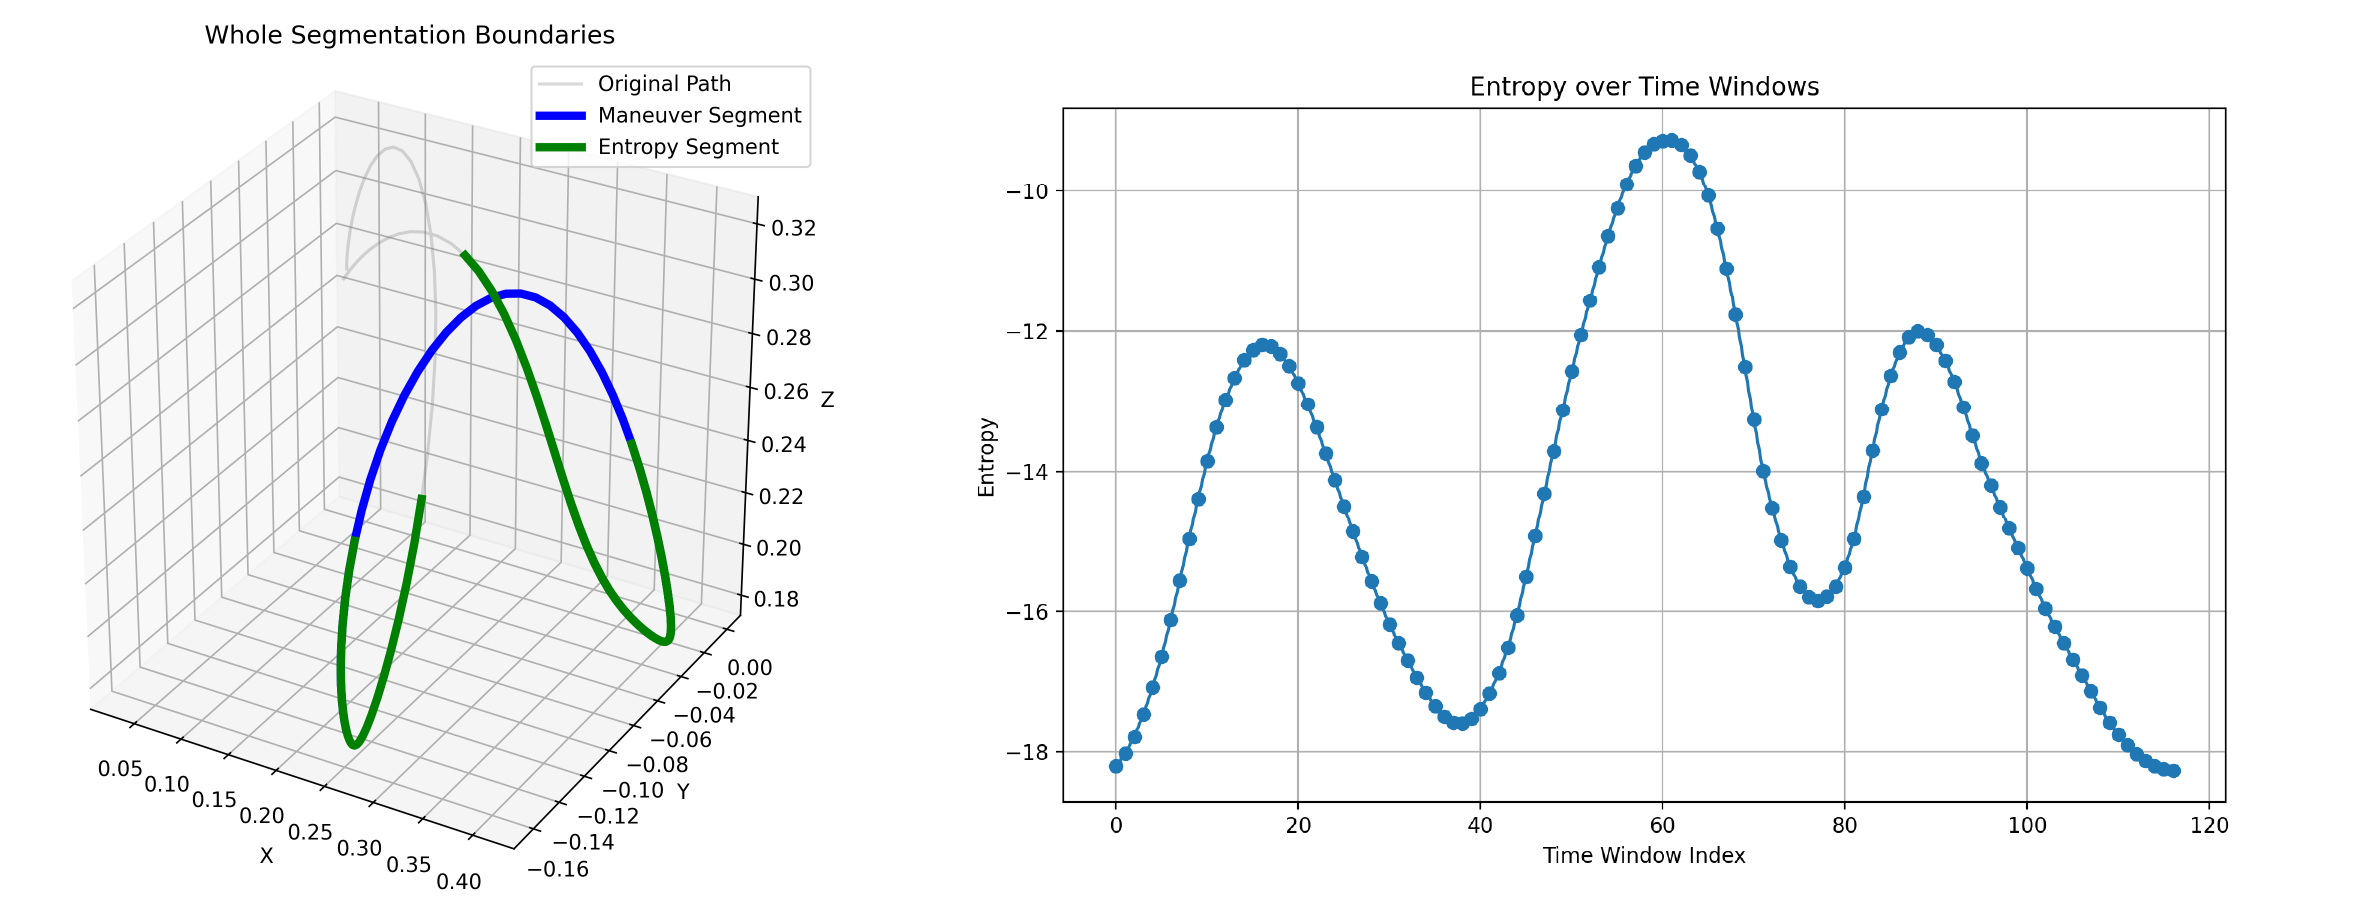
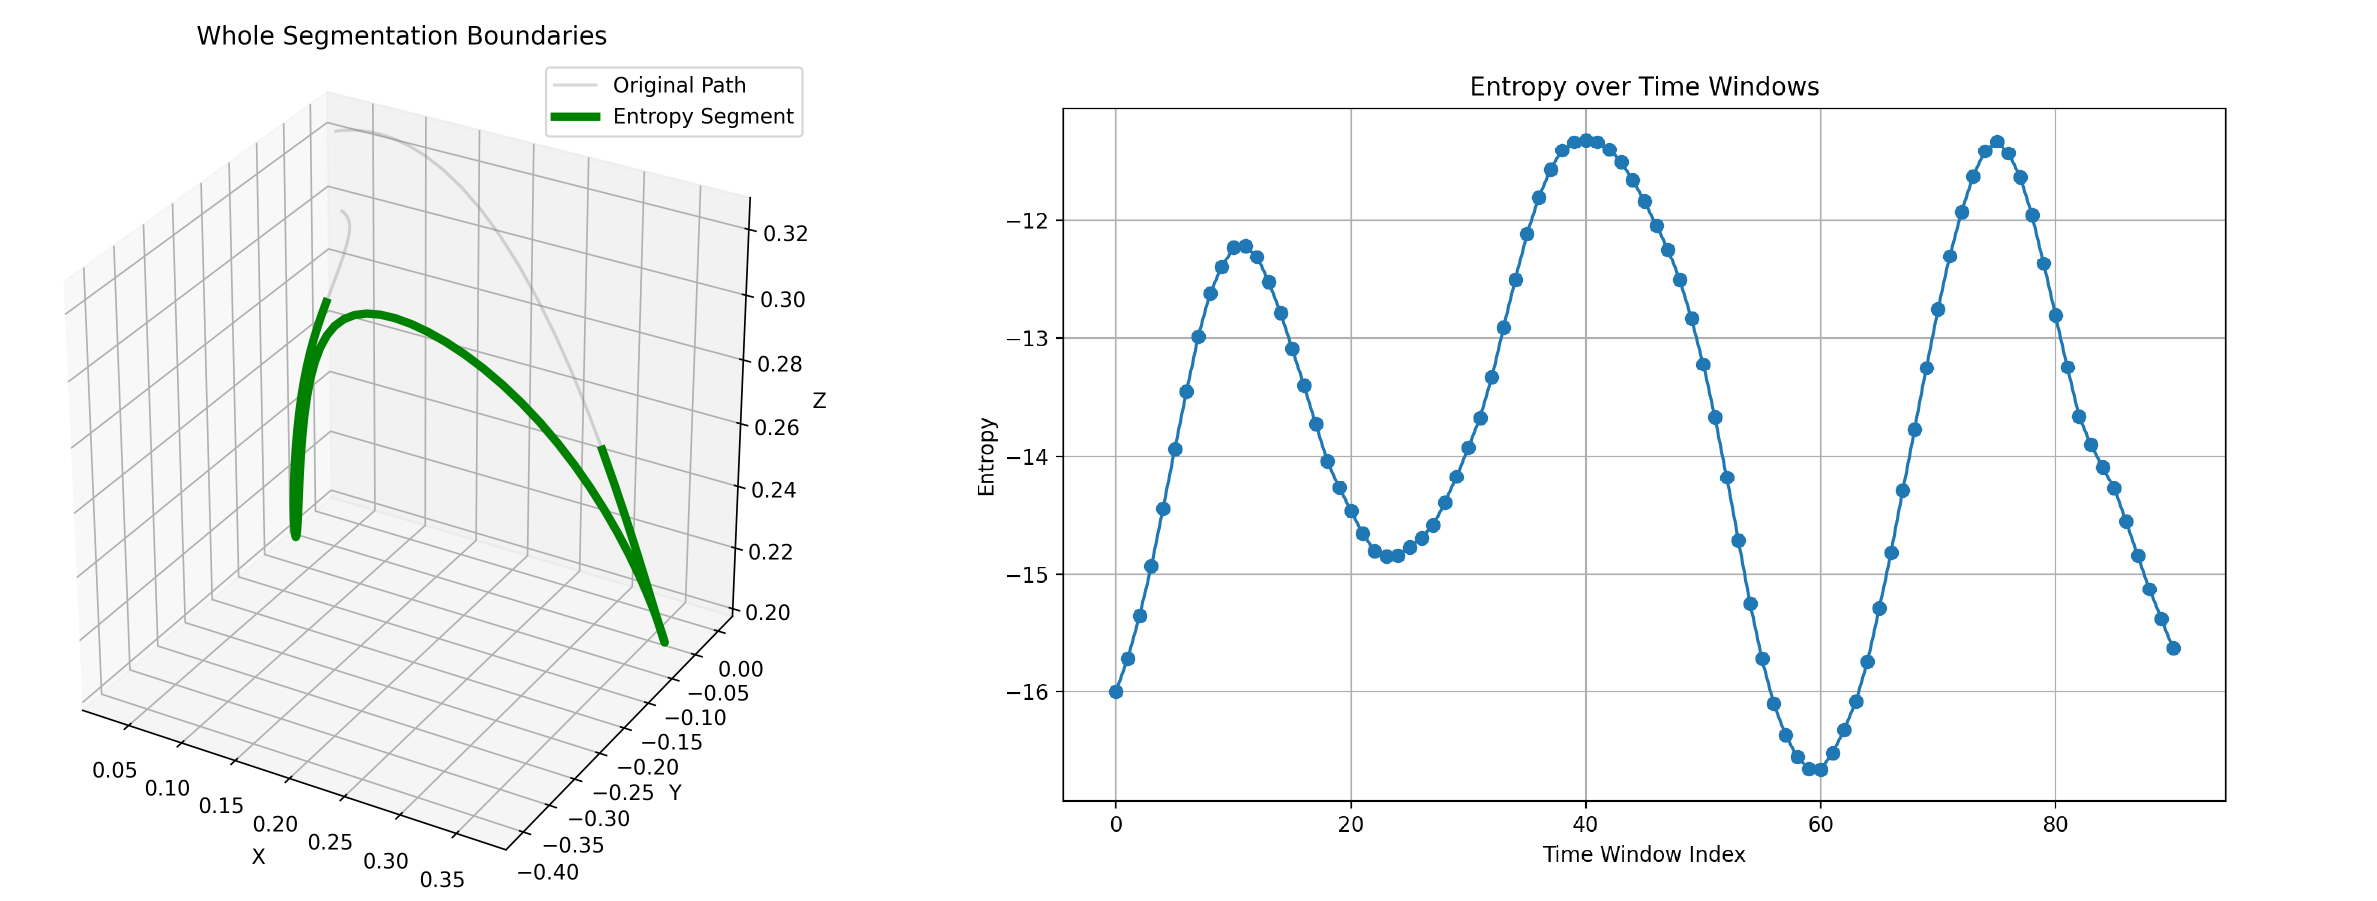
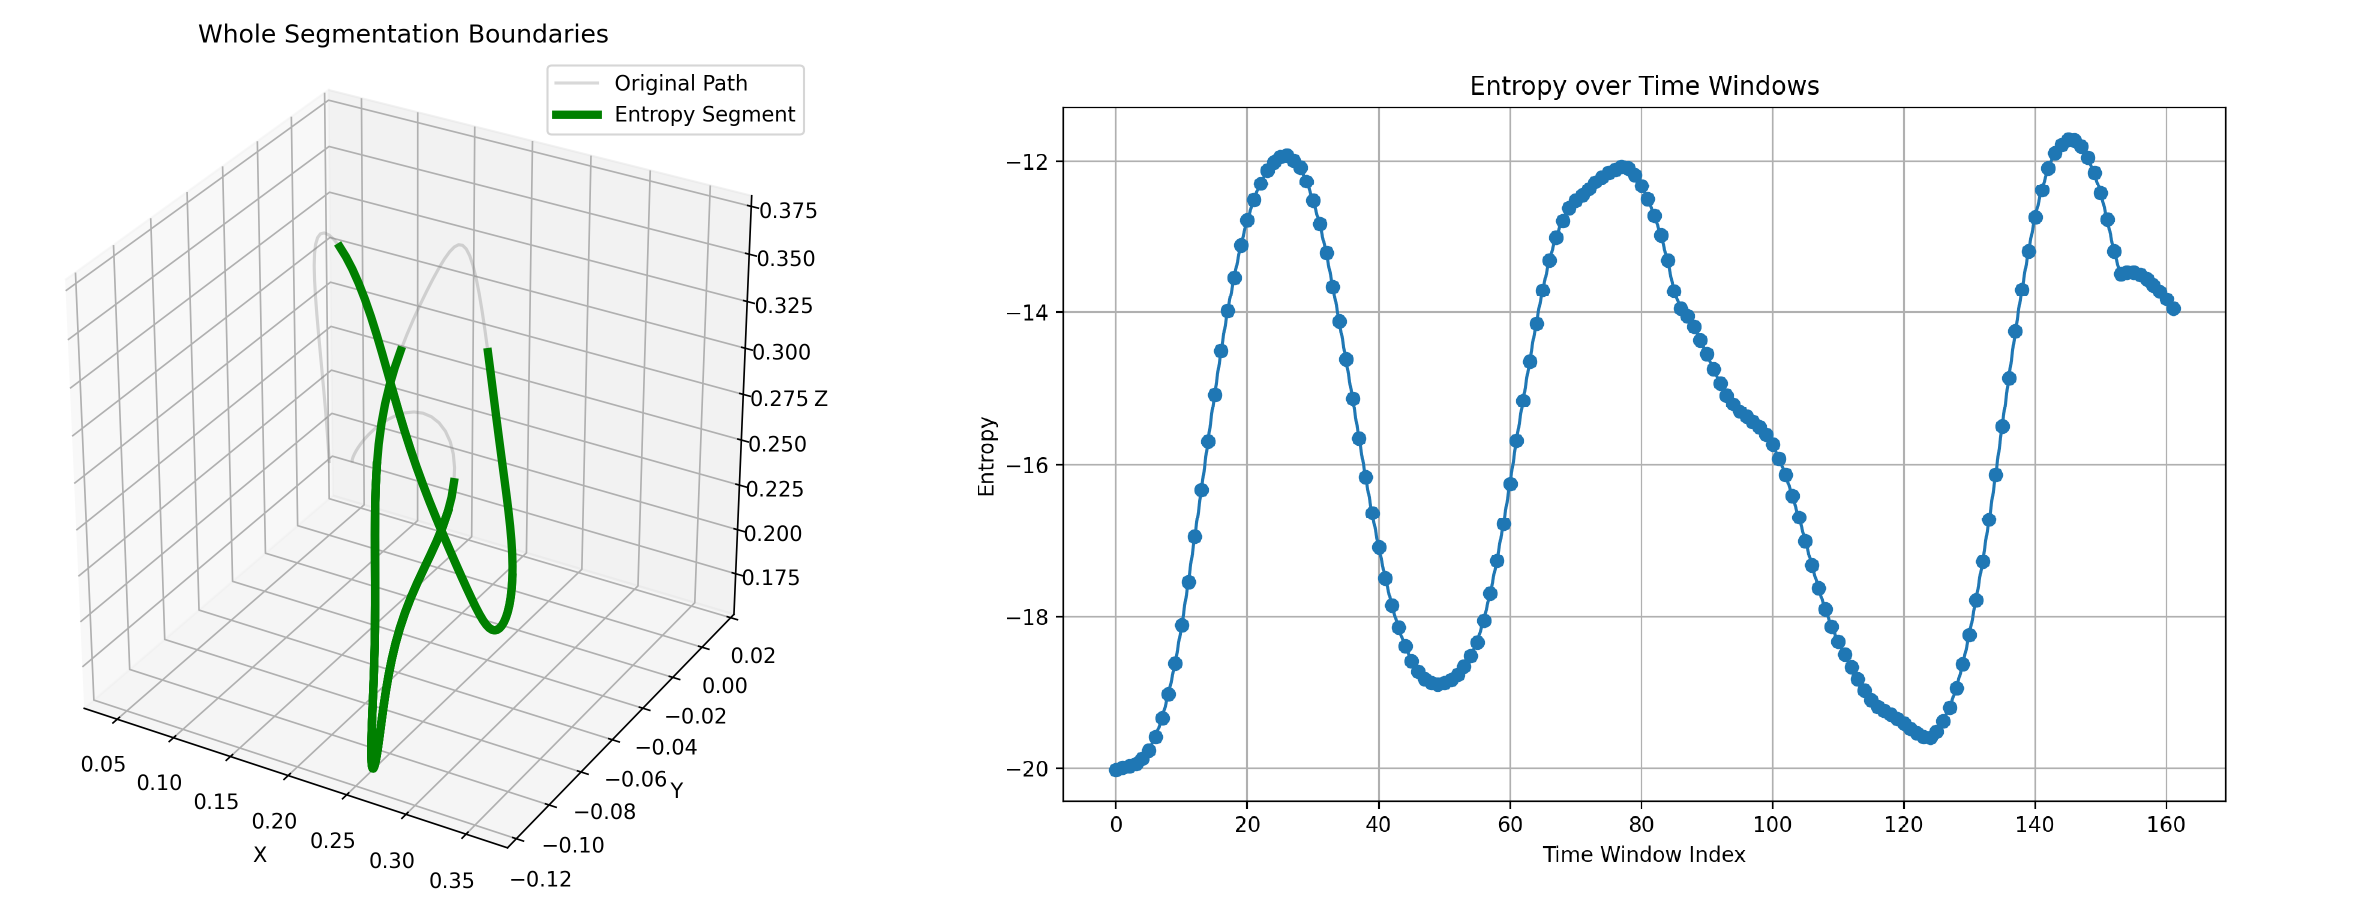
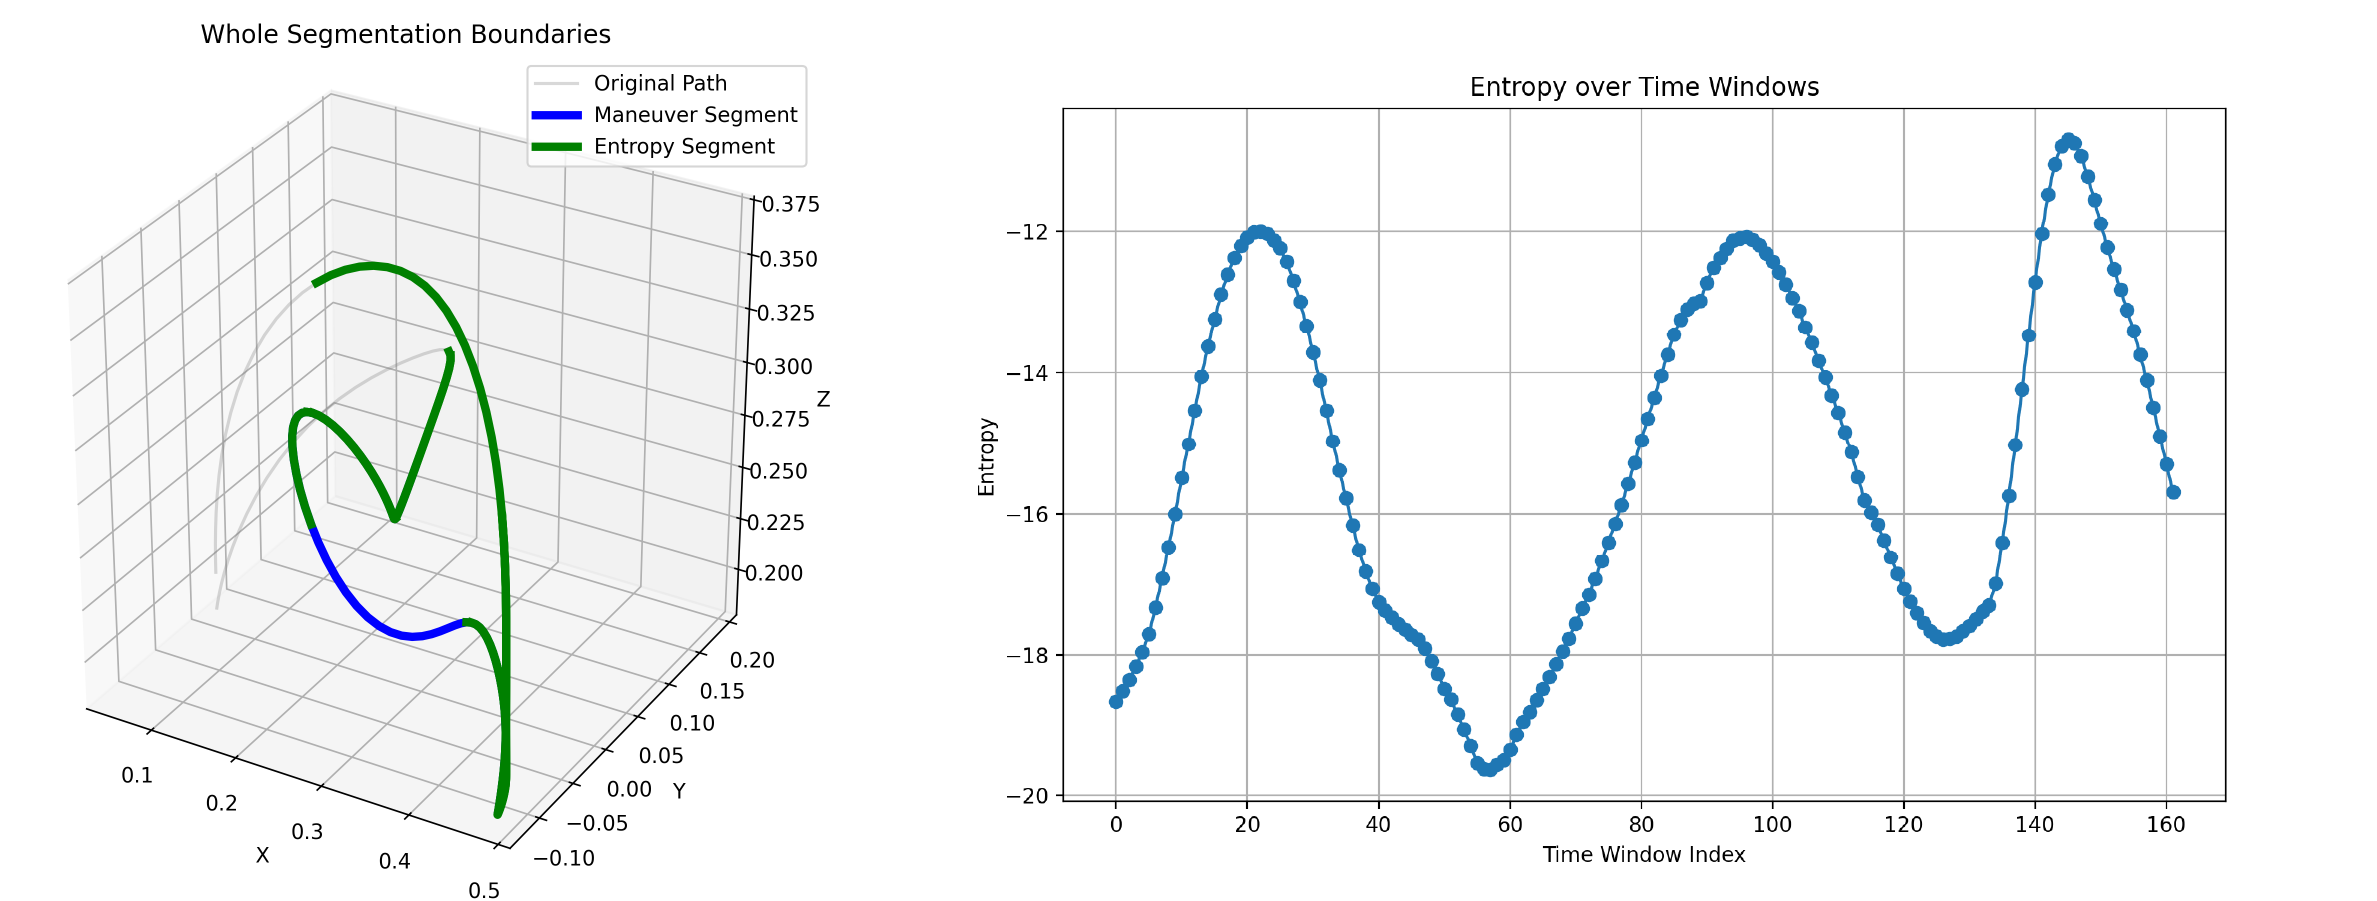
Through experimental analysis, we observe that the proposed TSD algorithm exhibits significant consistency in extracting critical task features, characterized by Numerical Consistency and Positional Consistency.
Abstract
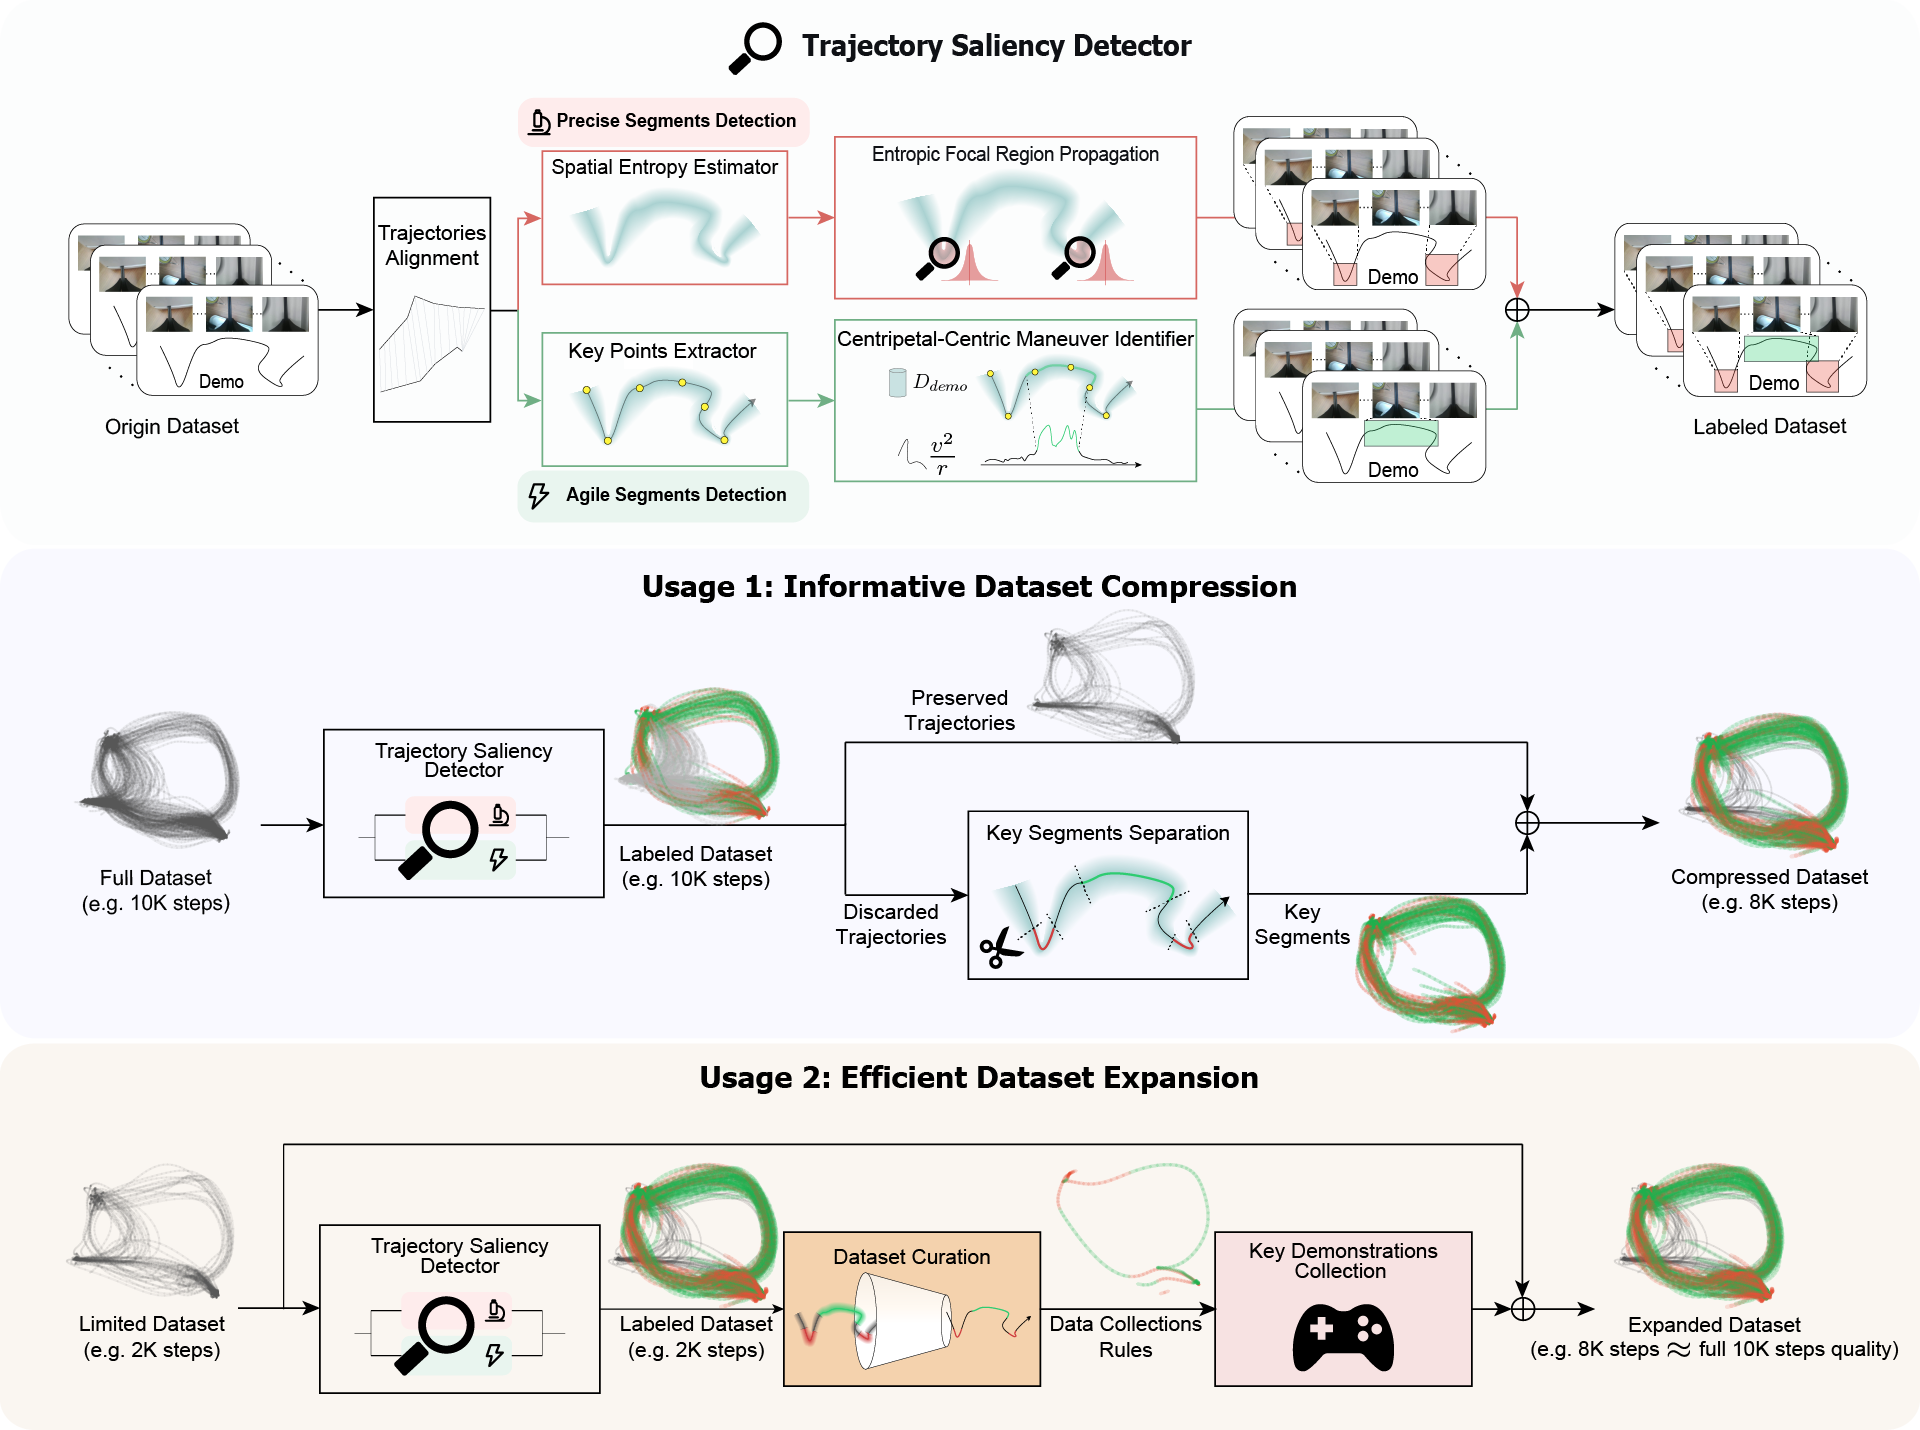
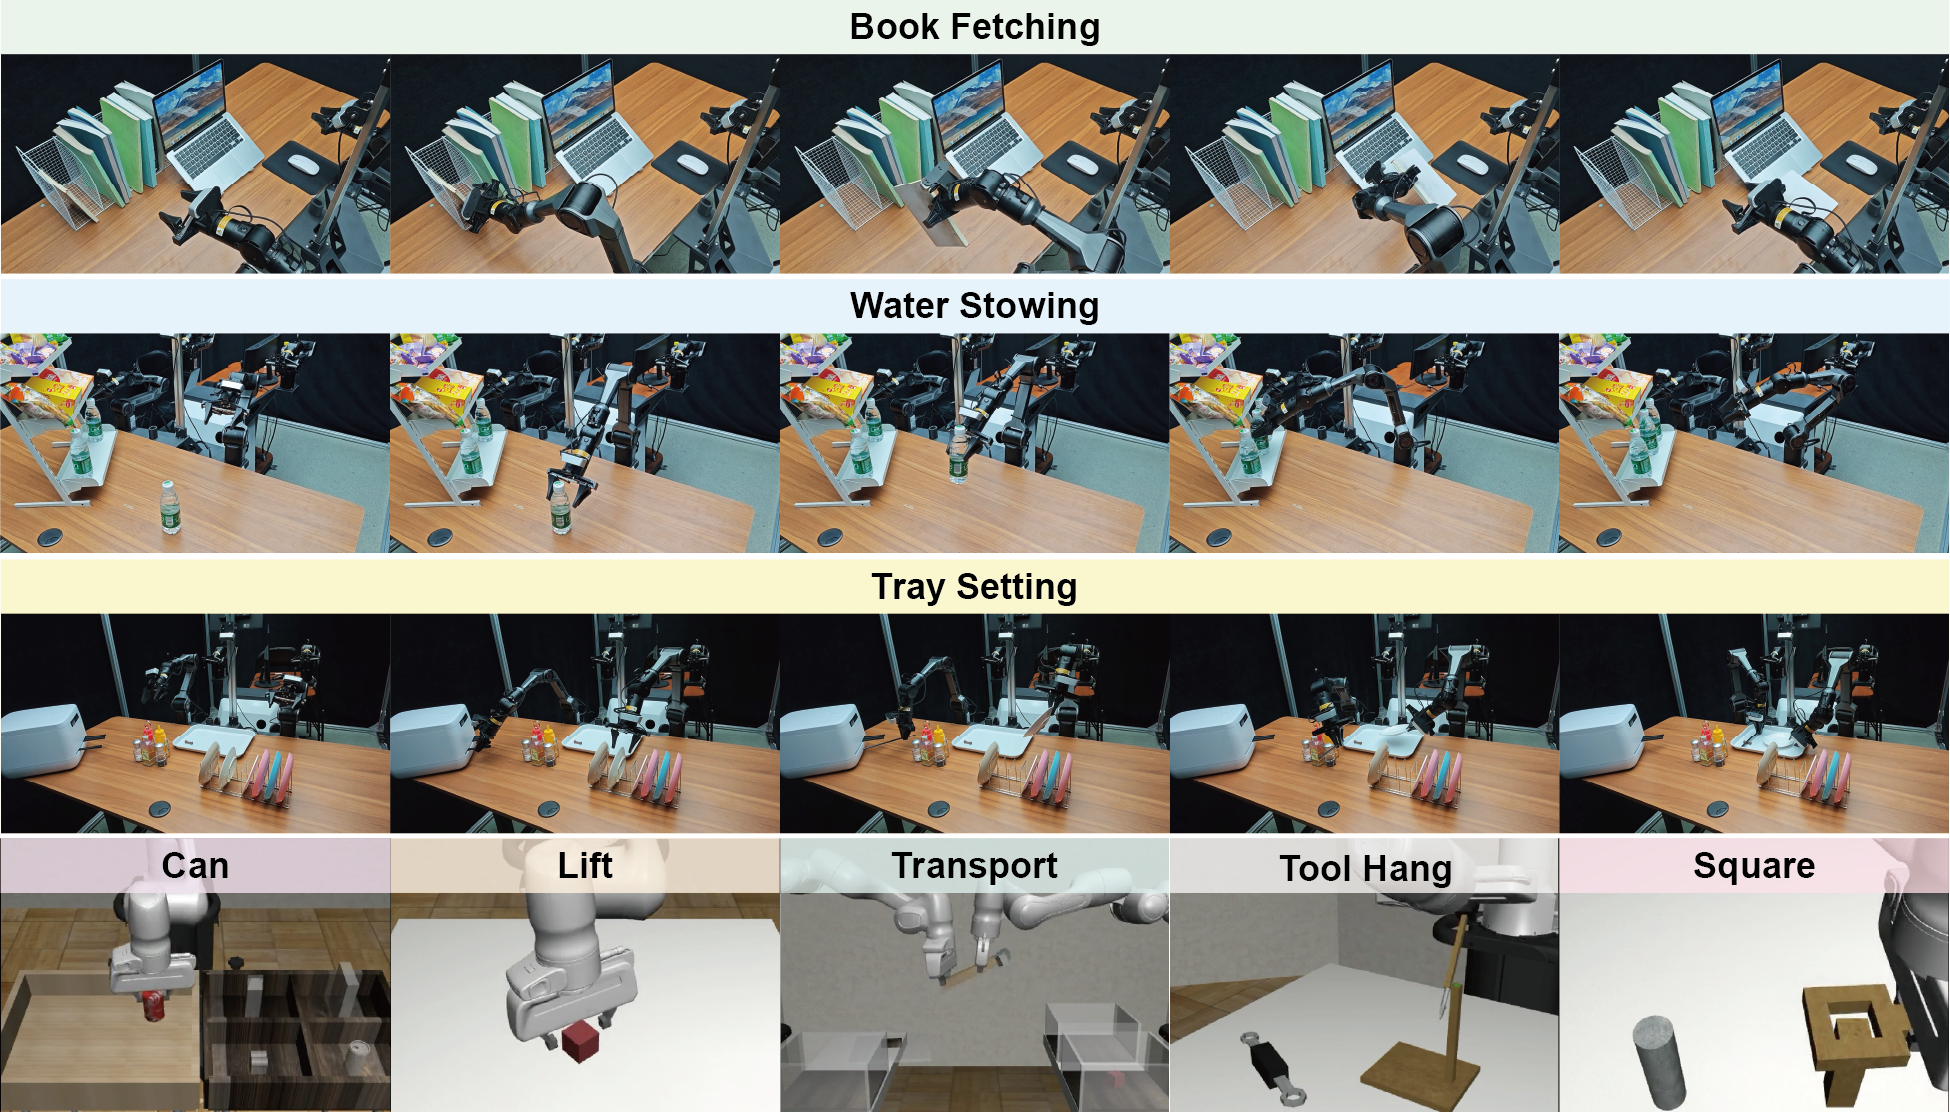
For imitation learning in robotic manipulation, high data collection costs result in the scarcity of high quality data. In this paper, we leverage the inherent heterogeneity of trajectories to address this challenge. Based on our observations of manipulation tasks, we categorize motions into transitional, precise, and agile types, defining the latter two as trajectory saliency due to their criticality to task success in contrast to the prevalent but less relevant transitional motions. Therefore, we propose the Trajectory Saliency Detector (TSD), a training-free and plug-and-play framework to identify trajectory saliency. TSD employs two physically-grounded metrics: spatial entropy to capture fine-grained manipulation and centripetal acceleration to detect agile maneuvering. We further leverage TSD to develop a dataset compression method that reduces training costs and a dataset expansion strategy that improves data collection efficiency. Extensive experiments in both simulation and real-world settings demonstrate that models trained on TSD-condensed datasets achieve comparable or even superior performance with 25% less data on average. These results validate the effectiveness of our dataset compression and expansion strategies, thereby confirming the utility of TSD. Consequently, TSD offers a scalable and cost-effective pathway to synthesize information-dense datasets for efficient robot learning.